

Making Space for Data Workflows and Conflict Cartography
- Ana Ranković
- Sep 4, 2025
- 5 min read
Welcome to the next installment of Making Space - a monthly memo for activists and changemakers about the ideas, tools, and stories that keep us moving, and how they might help you too.
In this issue, you’ll learn:
How to collect, visualize, and communicate your program data systematically and effectively
How one leading early literacy nonprofit became fully data-driven
How a multidisciplinary team of architects, coders, journalists, and lawyers applies innovative techniques to expose state crimes.
How RISE Alliance for Children is building trauma-informed learning spaces for displaced Palestinian children
Let’s get into it.
Olivia & Charles from North Arrow
A Starter Guide to Building a Program Data Pipeline: From Data Collection to Dashboard
At the core of our vision is a simple belief: the tools that power performance in the for-profit world should serve nonprofits too. Companies rely on dashboards to agree on what matters, measure it the same way everywhere, and review progress at a glance.
While most companies use data pipelines to measure profit, nonprofits can use the same general workflow to measure social impact: define indicators → collect consistently→ aggregate and visualize→ analyze. Build the pipeline once, and your team, board, and funders can see what’s working (and what isn’t) without digging through spreadsheets.
Here’s how to do it.
1) Introspection: define what matters
List the 4-6 program metrics you’ll track every month/quarter. Keep them specific and countable.
Below are some examples that organizations that focus on advocacy typically use:
People reached (by event/workshop)
Events & trainings delivered (by type)
Coalition activity (meetings, joint actions)
Media impact (mentions/placements)
Demographics when ethically available (e.g., race/ethnicity)
Original research/publications (with links)
🎯 Goal: agree on the handful of questions you’ll answer every month/quarter.
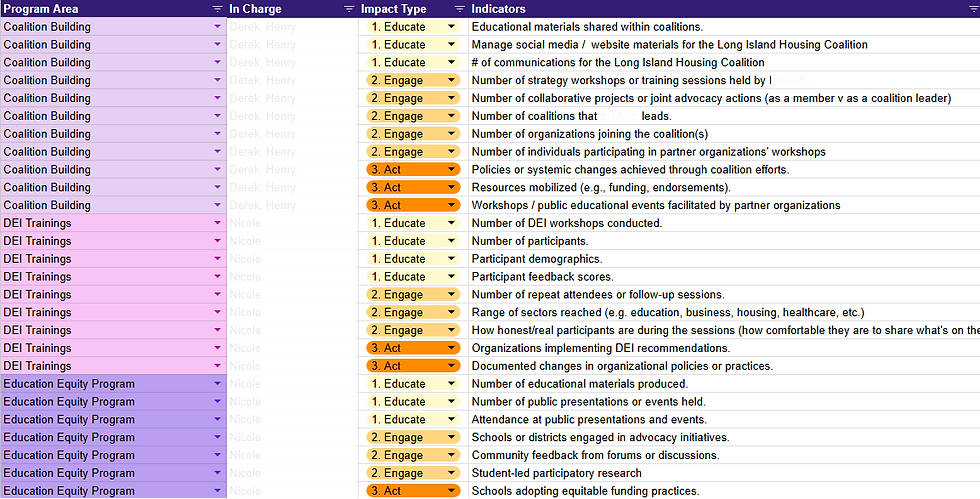
Below, an example of a list of impact indicators chosen by an advocacy nonprofit, by program and impact type.
2) Collection: collect systematically and consistently
Create a simple intake process for yourself and your team. This can be done directly into a templated spreadsheet format, or via a single intake form (Google Forms, for example) that writes to one Google Sheet. Keep it under 10 questions and use dropdowns so entries are clean.
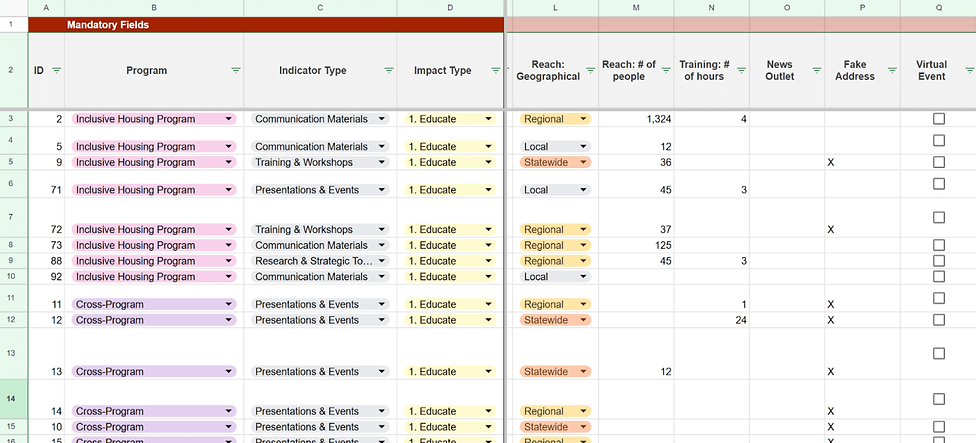
Here’s a Typical Data Schema you can copy and tailor (one row = one impact event).The template is
field name (TYPE), question method- value example
date (DATE), calendar pick - 2025-07-15
program (STRING), single picklist - Early Literacy Advocacy
impact_type (STRING), single picklist - Educate
event_type (STRING) - Workshop/Training
led_by (STRING), single/multi picklist - Olivia
people_reached (INTEGER), open numerical - 42
media_hits (INTEGER), open numerical - 1
coalition_name (STRING), multi picklist - Integration Coalition
address (GEO), address auto-fill - 24 Lenox Avenue, Westbury, NY
outcome (STRING), open text - Parents left with literacy kits; sign-ups doubled.
Create a one-page Data Dictionary (plain English definitions and collection guidelines)
Set a ritual to fill up the collection tool. This can be a recurring weekly reminder, or a dedicated moment to do it as a team. Consistency and regularity are key.
🎯 Goal: one simple form that writes to one simple sheet
Send us an email and we’ll share a copy-ready Google Sheet (tabs, dropdowns, example rows) and a matching v1 dashboard spec to help get you started.
3) Visualization: see impact at a glance
Use your dashboarding tool of choice. We like to recommend Looker Data Studio to our nonprofit partners. It’s free, and the learning curve isn’t as steep as with other tools. Connect directly to your Google Sheet.
🎯 Goal: one clear page that answers your questions fast.
Below, some visualization types we like to use.
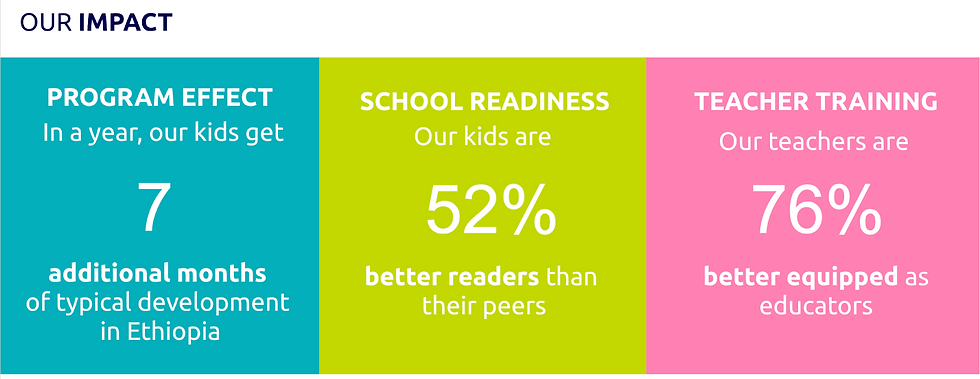
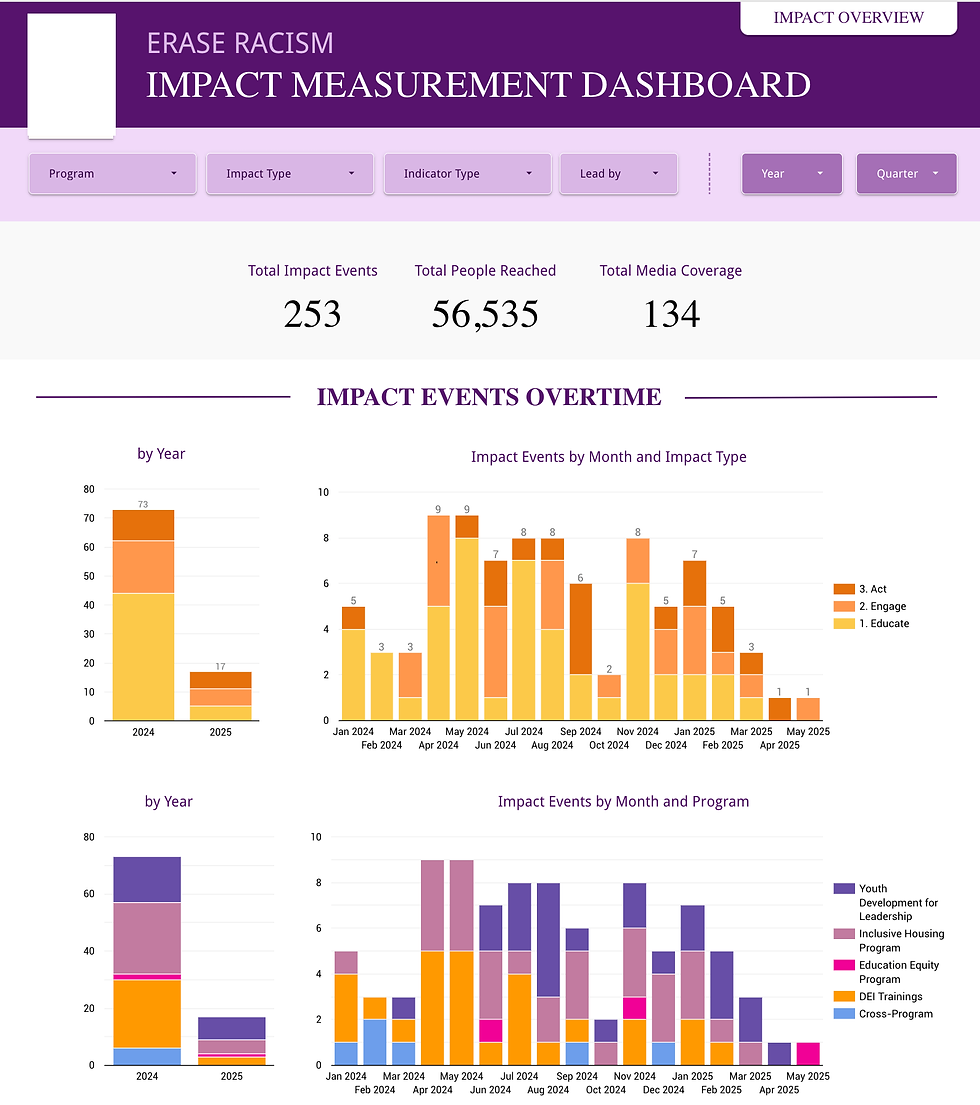
Scorecards to show snapshots of the most important impact indicators.
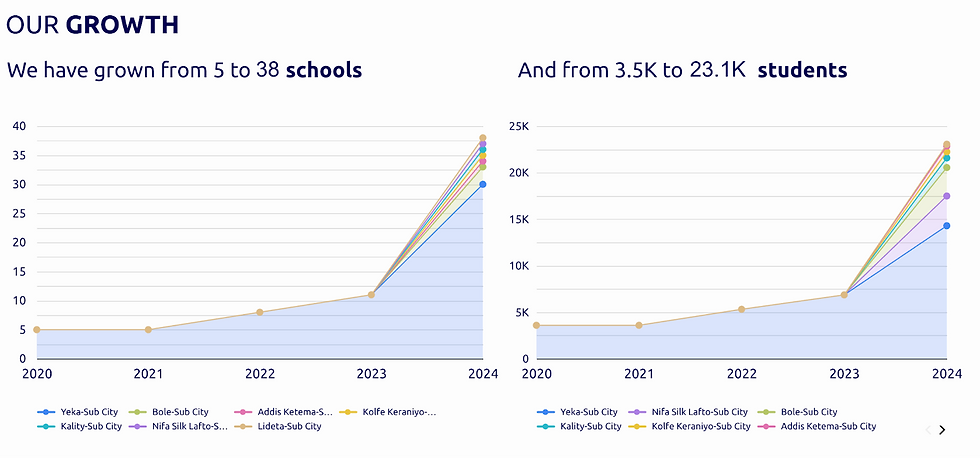
Time series charts to clearly demonstrate growth over time and the breadth of geographic reach.
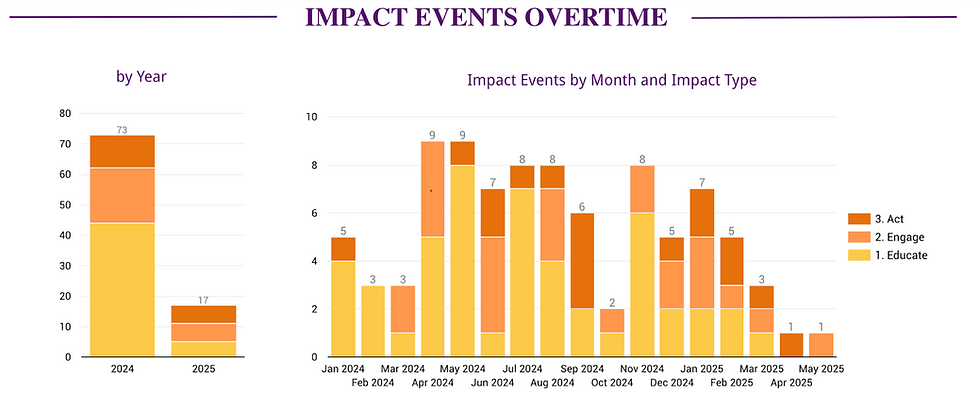
Bar charts by month and year, segmented by impact type or program, to show activity volume and mix over time, making it easy to spot seasonality, compare years, and report which programs drove engagement.
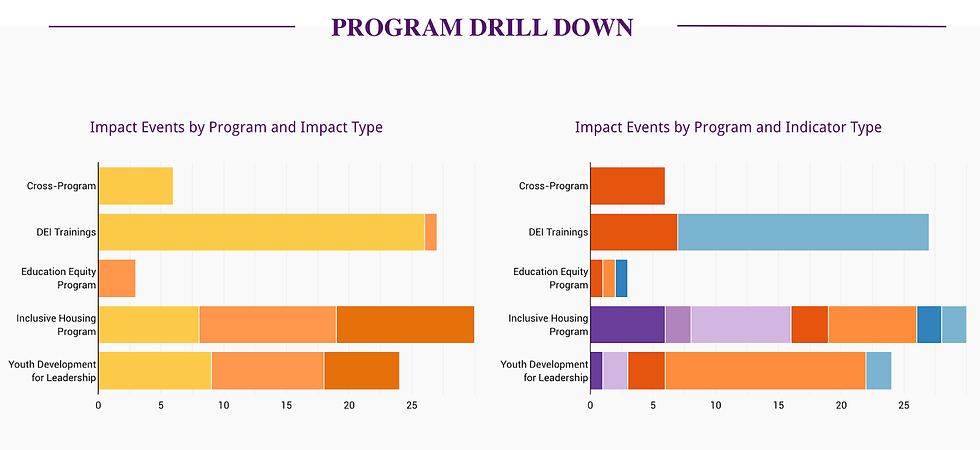
Bar charts (Program × Impact Type and Program × Indicator Type) to compare each program’s volume and activity mix, making it easy to spot where effort concentrates, what’s driving results, and where gaps remain.
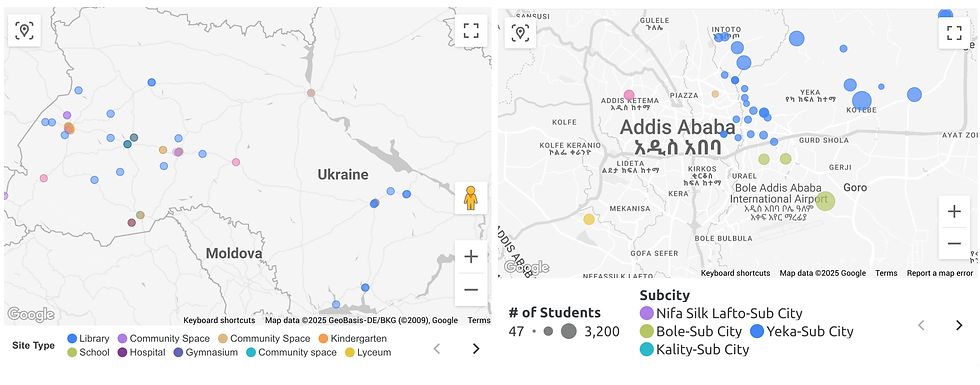
Use maps to pinpoint where services happen, size impact by site, and color by region/type, so gaps, clusters, and priorities are obvious at a glance.
4) Communication: turn insight into action
Your dashboard is ready. To get the most out of it, you need to include it in your communication efforts:
Board/leadership: export a filter-responsive PDF (this quarter, top programs, key outcomes).
Funders/partners: generate targeted one-pagers (filters set to their geography or area of interest)
Staff: a monthly “map room” review, 15 minutes scanning the trend and drill-down; capture 2–3 decisions.
Public / comms (optional): a simplified public page with an “About this data” note and a feedback link (“Did we miss an event?”).
Keep a Last Updated date on the page and a tiny change log (what changed since last month).
In the next editions, we’ll get more technical: step-by-step “here’s exactly how to do it” guides that spell out what you need (tools, fields, workflows), how to set it up on a modest budget, and how to keep it running with a quick monthly routine.
📣New Case Study!
If you’ve been looking for a clear example of what a “data-driven nonprofit” looks like in practice, this is it. Read to Grow paired program tracking with public indicators to spot literacy gaps, route services where they’re needed most.
This provided staff and the board a shared, at-a-glance dashboard—plus a public impact story anyone can explore. It’s a repeatable blueprint: decide what matters, collect it consistently, and turn it into decisions and storytelling.
🔦 Mapping Activist Spotlight
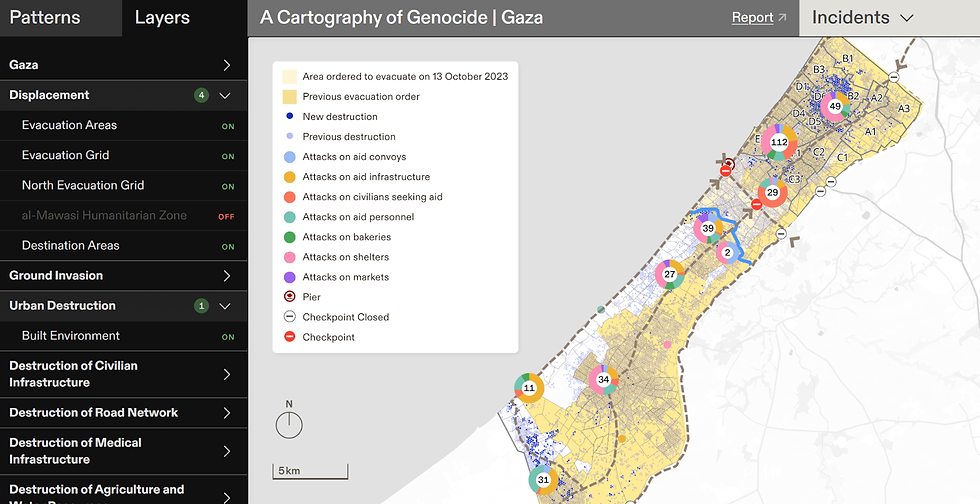
Forensic Architecture develops cutting-edge methods to investigate state and corporate violence. Their incredible multidisciplinary team of architects, coders, journalists, and lawyers applies innovative techniques to expose hidden crimes.
Their Cartography of Genocide platform documents Israel’s assault on Gaza since October 2023 with unprecedented precision. It maps thousands of attacks on every facet of civilian life—from shelters and hospitals to fields, bakeries, and sacred sites—while revealing how so-called evacuation orders and “safe zones” have been weaponized to displace populations. This work is urgent and vital: it transforms dispersed evidence into undeniable proof, forcing global attention on atrocities that demand accountability.
Awesome Nonprofit of the Month: RISE Alliance for Children
After a year of war and displacement, thousands of Palestinian children have been cut off from school, peers, and safe play - needs that won’t wait for a ceasefire.
RISE Alliance for Children is stepping in with trauma-informed learning and play so kids can find stability, community, and a path back to learning.
💬 If this sparked something, an idea, a question, or a project you’ve been meaning to start, we’d love to hear about it.
Let’s chat!
Until next time,
The North Arrow team


Comments