

Making Space for Data Your Community Trusts
Welcome to Making Space, our newsletter for nonprofit leaders navigating the real and challenging work of becoming more data-driven.
In this issue:
Why your team and community might push back on data, and how to earn their trust
How United for Brownsville turned a new dashboard into a meeting place for residents
5 minutes to protect the 2030 Census: comments close October 13
Let's get into it.
Olivia & Charles from North Arrow
When Data Feels Like Misrepresentation
🚨The Problem: In the late 1930s, federal appraisers mapped Brooklyn for mortgage risk and redlined Brownsville. Their notes say its "inhabitants are untidy and buildings present a very poor appearance." |
That map didn't just describe a neighborhood. It decided who could get a loan for decades. The pattern held: a 2018 NCRC study found that 74% of the neighborhoods graded "hazardous" back then are still low-to-moderate income today, and nearly two-thirds are majority-minority.
The story keeps being retold with newer numbers. Pick almost any outcome, and neighborhoods that were redlined, segregated or underinvested in for decades come out "behind". Those numbers end up in headlines ranking the worst places to live, raise a family or go to school, with no mention of the systems that produced them. First the disinvestment, then the blame. Scholar Eve Tuck has a name for this: damage-centered research, which documents a community's pain to win resources but leaves it seen as nothing more than broken.
So when a new data tool shows up, suspicion is a reasonable response. People who live and work in these communities expect it to highlight disparities at their expense, and many quietly opt out. That's why trust has to come before any talk of becoming data-driven.

So where do you start?
💡 The Solution: Put data tools in your team's and community's hands, and let them shape what the tools show and how the story gets told. |
In practice this means:
Build data tools with the community, not for them. One of the first steps is choosing what gets tracked. Bring the community in from the start, so the tools feel like theirs rather than something imposed on them.
Decide together how the story gets told. Anchor the tools in your mission, whether that's closing an opportunity gap or matching the resources of the city's wealthiest neighborhoods. The data should describe a system that needs fixing, not people falling behind.
Bring data tools into the work people already do. Use them in staff meetings and planning sessions to show how quickly your team can get information that helps it serve the community better. Every time someone answers a question faster or plans something better because of the data, point it out!
Let early adopters lead. Change management is one of the hardest parts of this work, but there are always early adopters who lead the way. Support them, and give it time.
Look for the wins. Show your team and community that the data is there to serve them, not only to point out what's wrong. When something improves, celebrate it.
One organization doing it well
United for Brownsville is a resident-led collaborative in the Brownsville neighborhood of Brooklyn working so that Black and Brown children and families can flourish. Its agenda is set by two groups that meet monthly: a Family Advisory Board of 15 parents and grandparents from the neighborhood, and a Provider Action Team of health, social service and education providers.
When UB joined the Starter Community Dashboard pilot we ran with Finding Common Purpose, it was growing from an early childhood focus to a cradle-to-career one. The dashboard we built had to reflect that, and the Family Advisory Board did the choosing. Over several meetings they narrowed a list of about 30 possible indicators to seven, from pre-K enrollment to child poverty. Not every call went the way director David Harrington expected, and a few he'd make differently now. That's the point: the list is theirs, and it can change.
The first reaction from UB's own team was rejection. David traces it to how data has been used in Brownsville: as he put it, it can feel like a cudgel. Working through the concerns slowly, together, moved the team to acceptance, and even some relief.
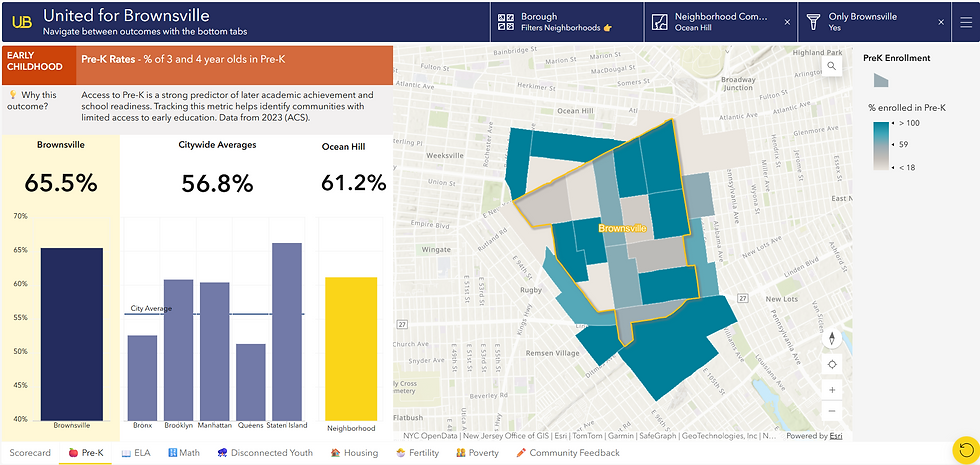
❌ Before: every data point about Brownsville seemed to confirm the same story of a community falling behind. The team worried that more data work would add fuel to the fire and be used to blame the community. |
💡 Now: the dashboard shows a win. Across Brownsville's Census tracts, 3- and 4-year-olds enroll in pre-K at higher-than-average rates, years after the neighborhood helped pioneer free early education in the city. Once the tools were in their hands and they could make sure the whole story got told, staff became much more open to using them. |
🌟 UB printed that chart for a provider forum at its community center. When the director of the Mayor's Office of Child Care and Early Childhood Education walked in, she stopped to study it. She had worked on that rollout, and had never seen its impact laid out like this.

→ Watch our conversation with David Harrington to learn how United for Brownsville started using data tools with no data team
Take Action: 5 minutes to protect the 2030 Census
Framing a gap as structural takes data that can show it. That's exactly what's at risk. On September 10, the Department of Commerce published a proposed rule that would reshape the 2030 Census. It would:
Redefine where people are counted, adding new "usual residence" criteria and excluding non-citizens from the counts used to apportion Congress.
Remove the race and ethnicity questions, which have been asked in some form on every census since 1790.
The decennial count is the base that the American Community Survey and nearly every other survey build on. Without it, organizations like United for Brownsville lose the numbers that show whether Black and Brown children are getting the same opportunities as everyone else, until at least 2040.
Comments close October 13 ! Posting one only requires three things: sharing who you are, which census-based data your work relies on, and what you would lose without it. CTData has a sample comment you can adapt in minutes.
→ Submit your comment (Document ID USBC-2026-0628-0001)
💬 Got thoughts?
If this sparks something, an idea, a question, a data challenge you’re wrestling with, let’s talk.
Until next time,
- The North Arrow team


Comments