

Making Space for Community Control of Data
- Ana Ranković
- Nov 22, 2025
- 5 min read
Updated: Mar 4
Welcome to the next installment of Making Space - a monthly memo for activists and changemakers about the ideas, tools, and stories that keep us moving, and how they might help you too.
In this issue, you’ll learn:
What Executive Directors of some of New York’s most important nonprofits have to say about their journey in becoming more data-driven
Highlights from our legislative workshop at SOMOS on community-led data tools
How Data for Good’s updated “climate bombs” map exposes 600+ fossil fuel megaprojects
How Data for Good (also) helped turn scattered WhatsApp messages into a live crisis-response map for migrants around Paris
Let’s get into it.
Olivia & Charles from North Arrow
Inside Our First NYC Community of Practice Gathering
Last month, we hosted our very first Community of Practice gathering in NYC! We wanted to create an environment that would encourage our nonprofit partners to share lessons and gain inspiration from each other’s journeys in becoming more data-driven.
In the room were leaders from the following 11 incredible organizations:
Arthur Ashe Institute for Urban Health
Coalition for Community School Excellence
New York Appleseed
Partnership With Children
Hostos Community College
Phipps Neighborhoods
NYC Climate Justice Hub
Rise Alliance for Children
United for Brownsville
Waterford Learning
Naugatuck Valley Project
We knew they would have a lot to talk about, but the breadth and depth of the conversation still blew us away.
Here are 4 key takeaways from our gathering.
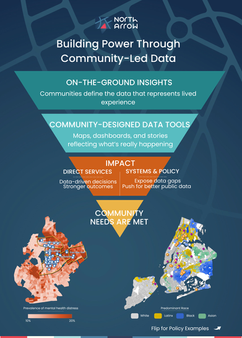
1. Community insight is the engine of powerful data tools
While North Arrow brings expertise in working with public data, our nonprofit partners bring on-the-ground insights to identify what data best reflects their communities.
There was a common sentiment that visualizing community needs rarely revealed something that they didn’t already know to be true; however, the real value came in being able to track how needs are evolving and communicate that in a clear, systematic, data-driven way to stakeholders.

2. The challenges of building a data culture
Everyone in the room recognized the same friction points:
Limited funding for data-related work, even though funders encourage organizations to be data-driven
A sector that is reactive rather than proactive when it comes to identifying community needs
To overcome some of these challenges, partners shared the following advice—don’t rely on only one person to manage the data; instead, invite everyone to “be curious about data” and contribute their insights.
Participants talked about inviting parents, students, staff, and community members to look at the same maps and charts and ask: What do you notice? What feels right? What feels off?
At RISE, for example, teachers are invited to review testing data and connect it to what they see in their classrooms, not as a compliance exercise, but as a chance to be curious together.
One story that stuck with people came from community health work in Peru. When local respiratory health data was displayed on the clinic walls, residents used their own observations to propose a simple intervention (wetting dusty roads during high winds) that dramatically reduced illness and mortality. It was a reminder that data becomes transformative when community members can see it, question it, and act on it.
3. Create iterations of data tools for different audiences
Partners discussed the challenges of designing a data tool that aims to do everything and speak to everyone. A key takeaway was to build the most comprehensive version first and then more focused iterations for select audiences. For example, when designing a map-based dashboard, you could have:
A comprehensive internal dashboard for leadership and program teams, where all the nuance lives.
A focused version for development, advocacy, or government relations, centered on the few indicators that support their external messaging.
A highly curated, mobile-friendly view for community members, where people can quickly find services, see what’s available in their neighborhood, or explore a small set of meaningful metrics.
Starting with a robust internal build and then iterating for other audiences felt both more realistic and more powerful than chasing the mythical “one tool that serves everyone.”
4. What to do when public data becomes unreliable
The final part of the conversation could have been its own event: what do you do when the public data you rely on becomes patchy, delayed, or politicized?
We discussed an emerging strategy–build your own collective evidence base. That means:
Sharing data across nonprofits working in the same neighborhoods or issue areas.
Exploring formal data-sharing agreements between schools, CBOs, and health providers.
Treating the nonprofit sector’s own data as a critical public asset, one that, in many cases, is richer and more current than official sources.
The vision that emerged was of a more decentralized data ecosystem, where community organizations are not just “end users” of public data but stewards and co-owners of the datasets that describe their communities.
What’s next
This first NYC Community of Practice gathering was intentionally simple. But looking ahead, we’re exploring ways to deepen this work. For now, we’re grateful to everyone who showed up, spoke honestly, and reminded us that our best tools are, and always will be, community-built.
We’ll share more in future editions of Making Space as this Community of Practice grows. Please reply if you’re interested in joining!
📍 SOMOS Puerto Rico Report
In November, we attended the SOMOS conference in Puerto Rico. As the largest annual gathering of New York-based nonprofits and elected officials, SOMOS is a vital venue for representatives to hear directly from community leaders about legislative priorities.
In that spirit, we co-hosted a session sponsored by Assembly Member Emerita Torres, highlighting the dual nature of data for underserved and marginalized communities. When unbridled and driven by external financial interests, data systems can be extremely harmful. However, communities can also be empowered through the collection and storytelling of their own human-centered data. Along with our fellow panelists, we advocated for urgent legislation to:
Protect vulnerable communities from the predations of AI.
Empower them with reliable, community-controlled, and representative data.
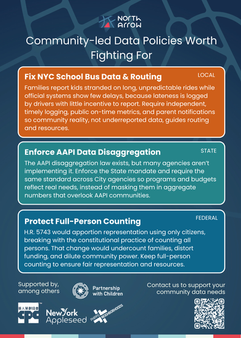
We also highlighted active policy efforts led by North Arrow partners. Please review these initiatives in the flyer below and consider supporting them. If you know of other policies we should add to this list, please let us know!


🔦 Mapping Activist Spotlight: CarbonBombs v2
In 2023, the civic tech collective Data for Good (more information below) set out to map all the future fossil fuel megaprojects set to completely derail us from any shot at keeping global warming below 1.5C.

With an updated version 2 years later, they sadly added 176 new projects to the initial list of 425 climate bombs. They find that the projected emissions of these planned infrastructure sites will eat up the equivalent of 11 times the budget we have before officially reaching 1.5C.
Beyond simply mapping sites, they also show finance networks to expose the enablers. An important and unambiguous effort at pointing out the responsibility of industrial behemoths, and an important tool to organize collective action against them.
🦄 Awesome Nonprofit of the Month: Data for Good (France)

Many nonprofit coalitions struggle with a common hurdle: they lack the integrated communication and data tools needed to share the on-the-ground knowledge essential for moving the needle efficiently.
When migrant support in and around Paris depended on scattered WhatsApp threads, response lagged and information went missing. Together with Data for Good, a collective of volunteer data nerds and civic tech activists, we built a lightweight field-reporting workflow and a live, map-based dashboard that brings everything into one place and enables faster, more coordinated humanitarian response.
Data for Good is also responsible for leading ambitious transparency campaigns against major polluters, through initiatives like the aforementioned CarbonBombs (exposing future fossil fuel megaprojects), PinkBombs (exposing the harm of the salmon industry) or Dans Mon Eau (In My Water, exposing health threats due to widespread tap water pollution).Look out for our case study of this work in the next installment of Making Space!
💬 If this sparked something, an idea, a question, or a project you’ve been meaning to start, we’d love to hear about it.
Until next time,
The North Arrow team