

What the New SNAP Rules Could Cost Each State
A map from the North Arrow Research Lab shows what every state could owe, when the costs begin, and who relies on SNAP the most.
For decades, the federal government has paid the full cost of SNAP food benefits, while states have run the program and shared the cost of administering it. The 2025 federal budget law changes that arrangement. Starting on October 1, 2027, states with a payment error rate of 6% or higher will have to cover part of their own benefit costs. These added costs could severely strain state budgets, leading to more food insecurity.
The share of the SNAP budget that states will have to pay is 5%, 10% or 15%, depending on how high the rate is, which can translate to hundreds of millions of dollars that states will need to come up with by next October.
A payment error is not the same as fraud. It means a household received too much or too little in benefits, most often because of a paperwork or processing mistake.
Part of the change is already in effect. Since October 1, 2026, states have been responsible for 75% of SNAP’s administrative costs, up from 50%.
What the map shows
Who Pays for SNAP? brings each state’s numbers together in one interactive map.
For any state, you can see:
Its cost-share tier, based on its payment error rate
An estimate of what it would owe each year (across all states, nearly $11 billion a year)
Who relies on SNAP there, including households with children, households with a member who has a disability, households below the poverty line, and households by race and ethnicity
Alongside the map is a short analysis that explains the numbers. It covers which states face the largest bills, why states with similar programs can owe very different amounts, and what the delay does and does not change.

Why New York stands out
The law gives states with especially high error rates, 13⅓% or above, extra time before they begin paying, and based on 2025 error rates, six states and Washington, D.C. qualify.
New York’s error rate is 13.18%, just short of that cutoff. As a result, New York lands in the highest tier with no extra time, and faces an estimated $1.15 billion a year starting in 2027. Illinois, with a higher error rate of 14.67%, qualifies for the delay and will not begin paying until 2028. It shows how the details of the law can produce results that are hard to anticipate, and why it helps to look closely at your own state.

How you can use it
The map and analysis are designed to be used directly in your work. You can bring your state’s figures into a board presentation or a grant proposal, and the downloadable one-pager gives a plain-language summary of the rules alongside the key numbers.
If you meet with lawmakers or state agency staff, the data can support a practical conversation about how your state plans to reduce payment errors, whether through more caseworkers, better systems or additional training, so that the cost does not fall on the families who rely on the program.
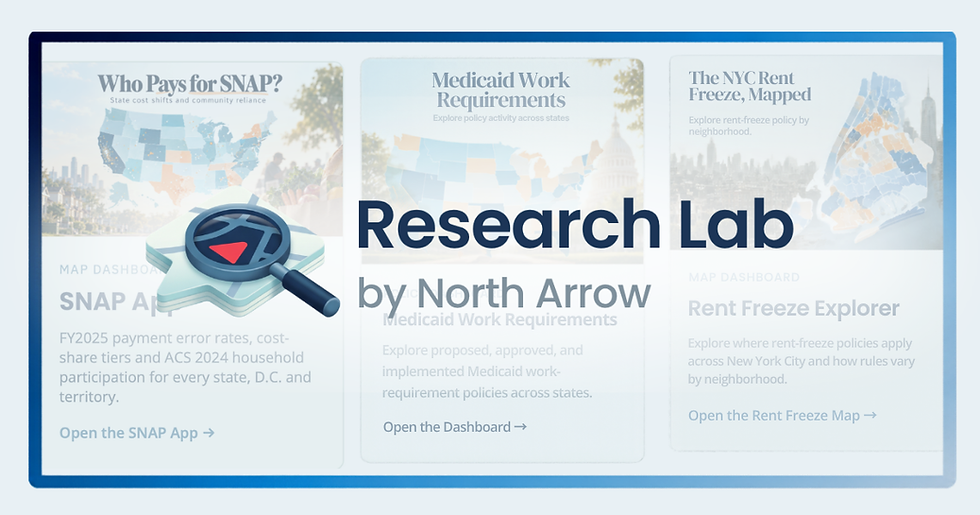
Who Pays for SNAP? is the first piece from the North Arrow Research Lab, our new home for free maps, data and analysis on the policy decisions that shape your community.
You can explore the full map and analysis at lab.north-arrow.org/snap.
Comments